-1.png?height=120&name=ShareBuilders%20Logo%20(07052023)-1.png)
Changing settings on the demand curve.
Demand Curve Strategy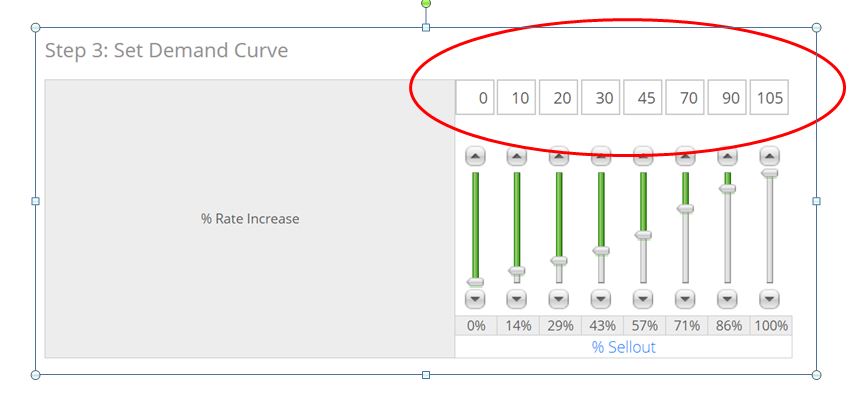
- The demand curve controls the calculation that determines the rates shown when you generate a rate card. Three variables will affect the final rate, the Minimum and Maximum Rates you have set and the current sellout percentage of that inventory.
- The calculation will look at the difference between the Minimum and Maximum rate and move the Recommended Rate by a percentage that you may adjust freely.
- Highlighted above is the current rate of increase. In this example, at a 50% sellout, the Recommended Rate will be 30% between the Minimum Rate. If your Minimum Rate is set at $100 and the Maximum Rate is set at $200, the Recommended Rate on the Rate Card would be $130 at a 50% sellout.
- In the example above, you can see the rate escalation is very gradual until the inventory is over a 71% sellout. We will go through a few more examples to highlight separate strategies that will help you better manage rates.
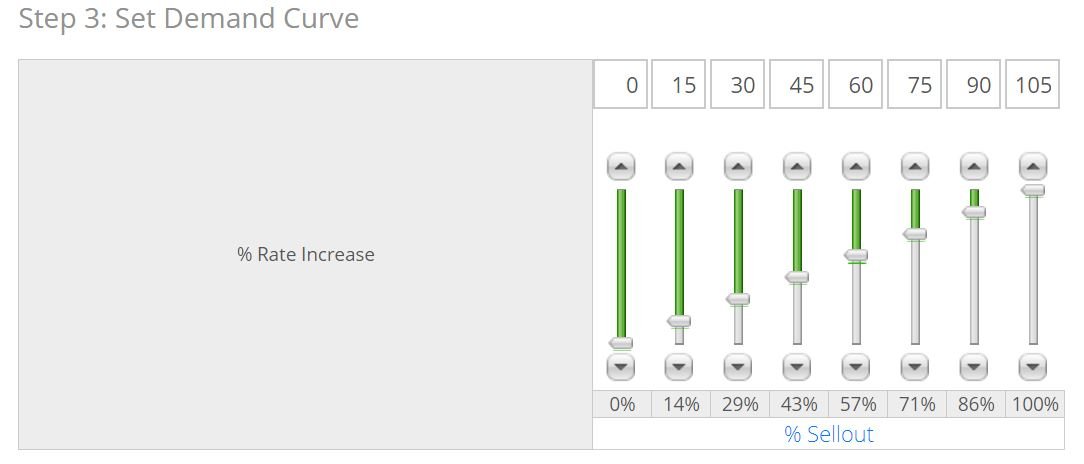
In the above example, rates will be raised steadily as sellouts increase. This will give us a total of eight different rates an each increase will the be the same as the last.
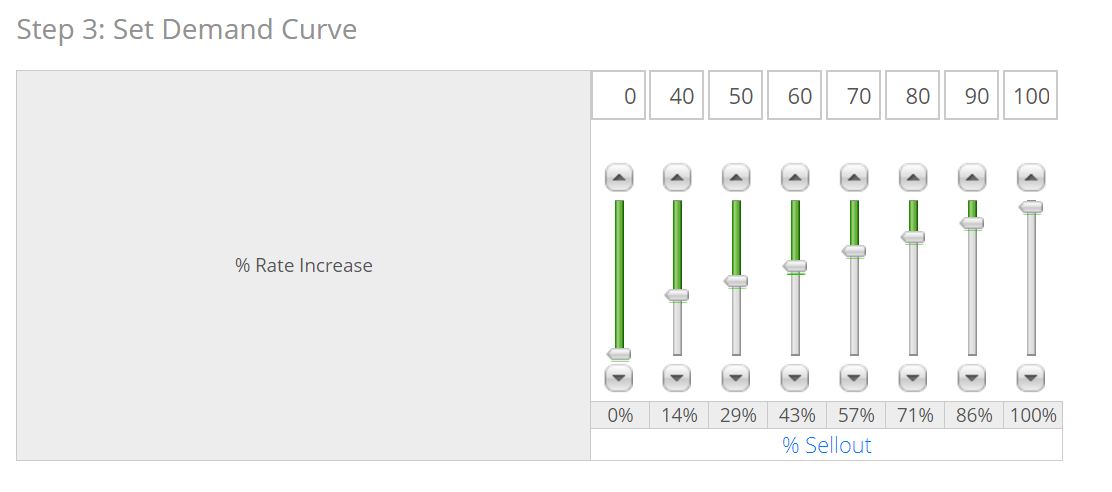
In this next example, we increase rates dramatically after our initial discounted business, or annuals and then increase rates at a consistent rate after our first increase.
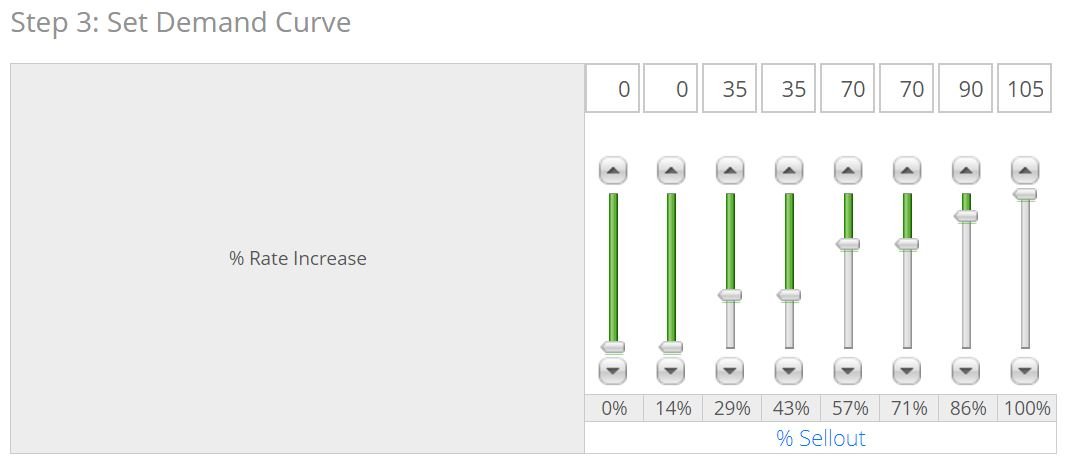
- In this set up, we have only three separate rates until we reach an 86% sellout. This will simplify things for the sales staff and keeps rates consistent for longer periods of time. Keep in mind that this will keep rates steady even if sellouts are increasing rapidly.
Think about how you want to react to changes in demand as you adjust both your demand curve and your Minimum Rate and Maximum Rate. Monitor both your inventory and your Recommended Rate and how they change over time to help determine the optimal pricing strategy. Changing and adapting rate strategy is especially important in our dynamic business.