This chart displays how much money was on the books for the Time Period selected for the current year and the available prior years.
Chart
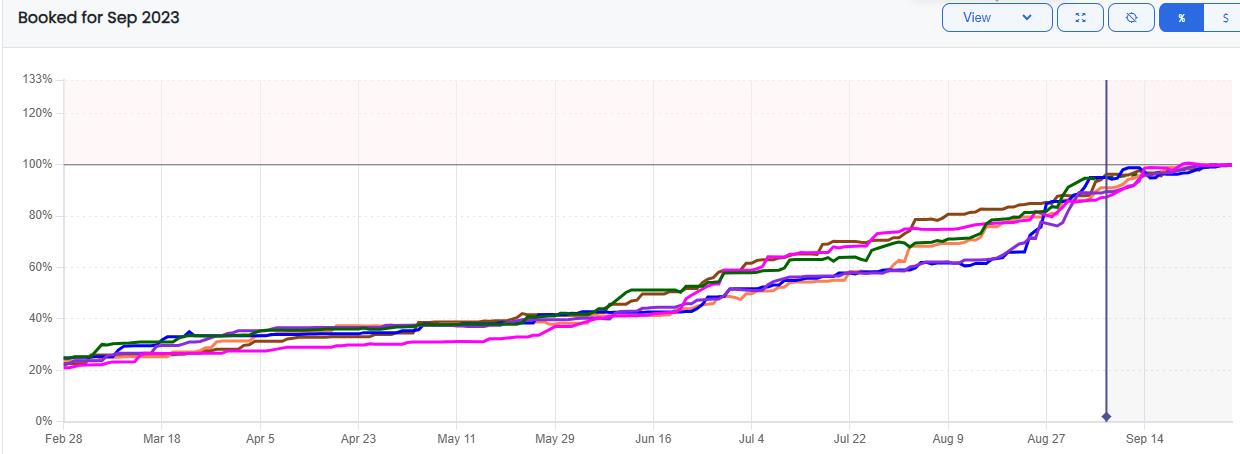
- The default Time Period is the current month.
- The default Revenue Type is Local.
- The vertical blue line represents today's date.
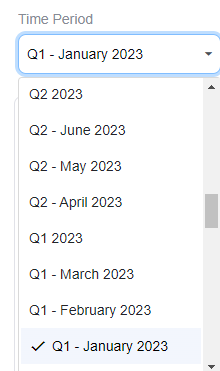
Time Period
Use the Time Period selector to view a particular month or quarter. Your desired selection will change the chart view.
Revenue Type
Use the Revenue Type selector to select the revenue type or combination of types you wish to view. Click on the text or checkboxes to combine revenue types. Click outside the box to refresh the view.
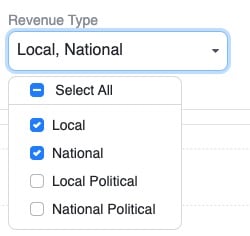
Chart Header Buttons

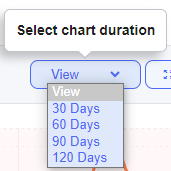
- View: Chart Duration Dropdown. You no longer need to scroll around to find a date on the chart. Just quickly zoom in or out to a specific time using the Chart Duration dropdown above the chart.
- Reset Zoom: Zoom in too far and get lost? Click the reset zoom button on the chart to start over.

- Toggle Data Points: Data points for the lines are turned off by default, but you can turn them back on by clicking the Points button above the chart.
- Toggle Percent and Dollars: Easily switch between percent and booked revenue dollars mode by clicking the percent and dollars toggle above the chart.

Legend
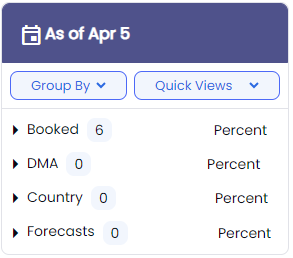
Check or uncheck the numerous available options to select what you want to display on the chart.
-1.png?height=120&name=ShareBuilders%20Logo%20(07052023)-1.png)