Inventory Details is a deep-dive inventory view that helps you understand spot-level availability and demand signals. It’s built to help you:
assess sellout risk (where you’re tight or trending tight),
find opportunity (where you’re open / under-sold),
and prioritize the inventory that matters most.
Inventory Details is made up of two main parts:
a Tree (left) to drill into dayparts and programs, and
a Chart (right) to visualize sellout, rates, and forecasting signals for what you selected.
Helps you avoid pricing in the dark by showing where inventory is open, tight, volatile, or on-target.
Makes it easier to build packages and move inventory intentionally (especially when a daypart needs help).
Gives leaders a shared “truth screen” for coaching: what’s tight, what’s soft, and what action should follow.
Sales Principle: Don’t discount to solve an inventory problem you haven’t diagnosed. Inventory Details helps you choose the right move—hold, flex, package, or protect rate—based on what’s actually happening.
On the left, use the dropdown arrows to expand and drill down. You’ll see:
a count of shows in each branch, and
a checkmark next to the show(s) currently selected.
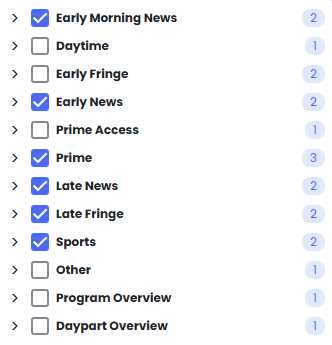
Key ways to use the Tree:
Dayparts: View a daypart as a whole or break it into specific programs. This is especially useful when building packages to fill open inventory in a particular daypart.
Program Overview: Identify programs that are open, tight, volatile, or on-target.
Daypart Overview: Identify dayparts that are open, tight, volatile, or on-target.
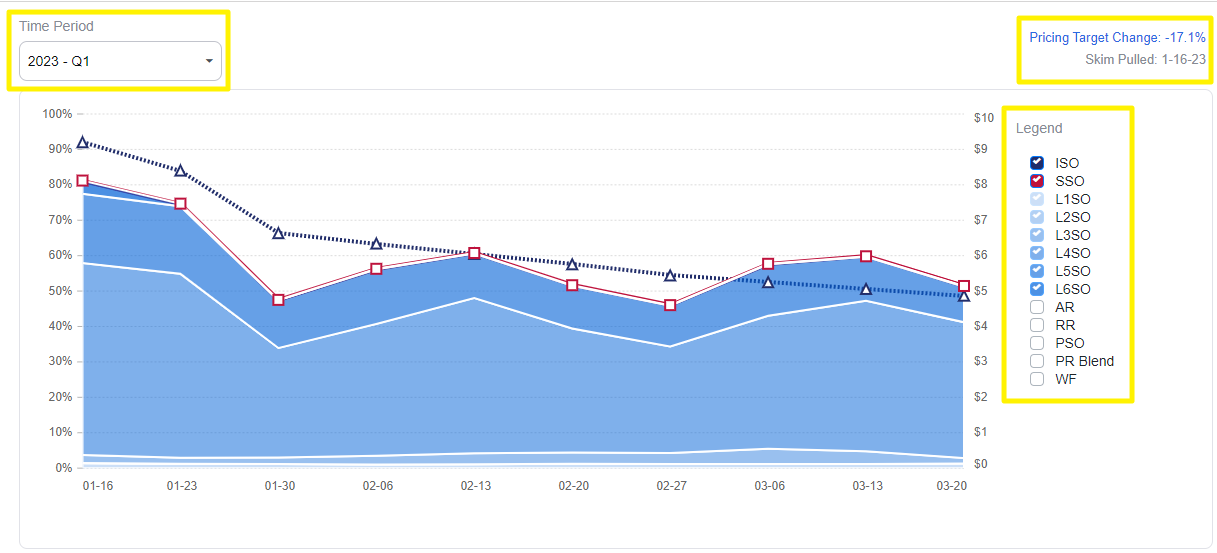
On the right, the Chart helps you read what your selected daypart/program is telling you.
Time Period
First, confirm you’re viewing the correct quarter.
Only quarters with a downloaded inventory report will appear as options.
Legend (toggle lines on/off)
Use the legend to simplify the view and focus on what you’re trying to answer. Common legend items include:
ISO (Ideal Sellout): Benchmark for where sellout “should” be today based on forecast demand.
SSO (Skim Sellout): Percent sold from your inventory report.
Layers: Skim sellout percent across sections within the selected layer.
AR (Average Rate): Average rate for all spots sold.
RR (Recommended Rate): Calculated rate factoring in Planning Rate and current demand.
PSO (Projected Sellout): Where you’re on track to finish at your current rate of inventory consumption.
PR Blend (Planning Rate Blend): The average rate needed to make forecast.
WF (Weekly Forecast): Forecast dollars to air by week.
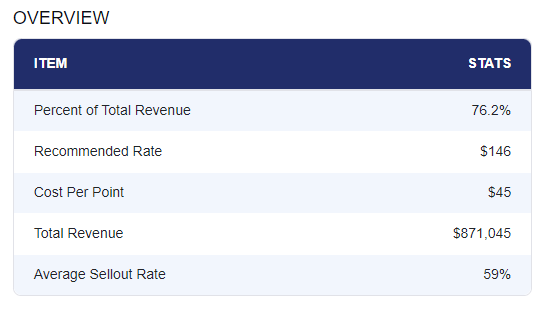
Overview
Compiled stats for the show(s) you selected. Your quick summary before taking action.
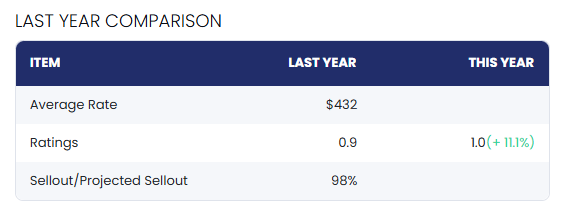
LY Comparison
Side-by-side context for Average Rate, Ratings, and Sellout (Last Year vs This Year), so you can tell whether you’re seeing a real shift or normal seasonality.