The Pacing module shows how your station is performing by comparing current year-to-date booked revenue against the same day/point in time from the prior year. It’s a fast way to see whether you’re ahead, behind, or flat versus last year’s selling pace, and it supports smarter forecasting and mid-quarter adjustments.
Quick performance check: Instantly see if sales are pacing ahead or behind last year at the same point in time.
Better decisions, earlier: Spot momentum shifts early enough to adjust strategy (rate, inventory focus, seller priorities).
Cleaner conversations: Align leadership, pricing, and sales on the same “scoreboard.”
Sales Principle: You can’t coach what you can’t see. Pacing turns “how are we doing?” into a measurable, coachable number.
Open Pacing.
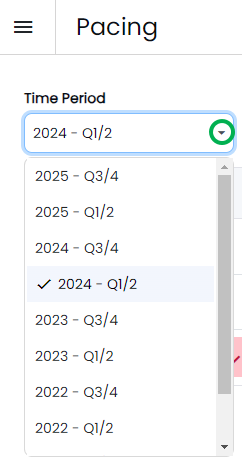
Use the Time Period dropdown to select the quarter you want to review.
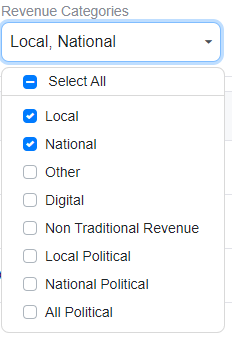
Use the Revenue Categories toggle to select what you want to include.
Local is the default, but you can combine categories by checking multiple boxes (selected boxes show as blue).
Example: Select Local + National to view a combined pace.
You’ll see a snapshot that includes:
Prior year finals
Current year forecast
Current pace displayed as a percentage (today vs. the same day last year)
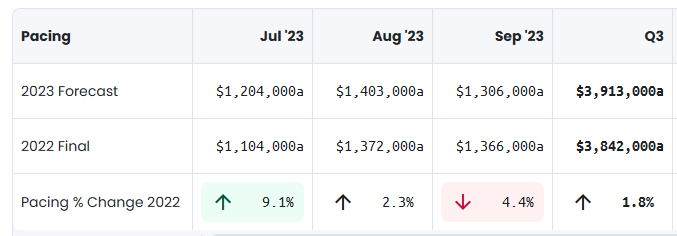
Use that pace percentage as your “at-a-glance” indicator of whether you’re trending ahead or behind.
Pacing reflects the last time data was loaded into ShareBuilder:
Stations that auto-load typically update nightly.
Stations that manually send reports typically update weekly (often on the station’s call day).