Month to Month is a view inside the Forecasting module that lets you compare pacing and forecast performance across multiple months. It helps you highlight trends over time by selecting a reference period(s) and year(s) to compare, then reviewing the results in a table.
Helps you detect seasonal shifts and trend changes that don’t always show up in a single-month view.
Supports stronger inventory planning by showing where pacing/forecast is building (or softening) across multiple months.
Gives you better long-term pricing posture: you can adjust earlier when you see a multi-month pattern forming.
Sales Principle: You can’t coach what you can’t see. Month-to-Month turns “it feels different” into a clear trend you can act on.
Go to the Forecasting module.
In the top banner, click the arrows icon (Month-to-Month Projection).

In the pop-up window, select the reference period(s) you want to evaluate.
Select the year(s) you want to compare against.
Confirm your selections to generate the view.
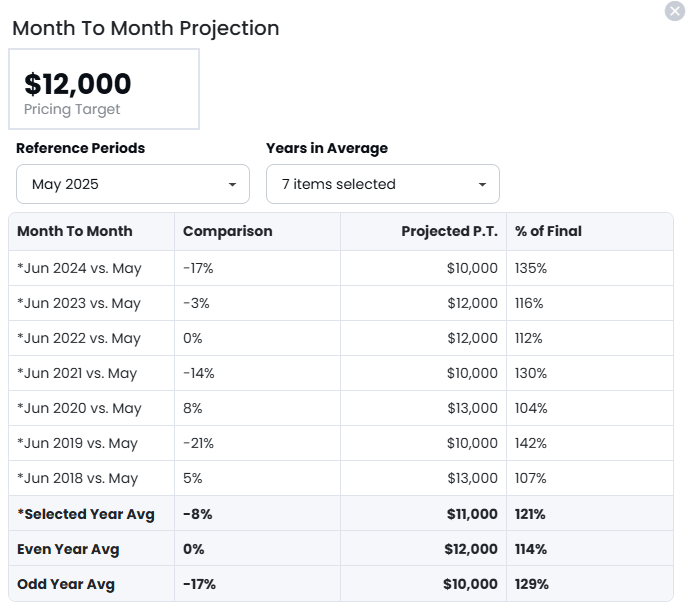
Month-to-Month displays your selections in a table, making it easy to scan performance across months and identify patterns you can respond to.