Holding Capacity is a measurement of your station’s ability to hold revenue share within your market. It’s used to understand how your performance compares to what your station is “expected” to earn, often through a lens like cost per rating point (CPP/CPRP) or cost per impression point.
Holding Capacity includes:
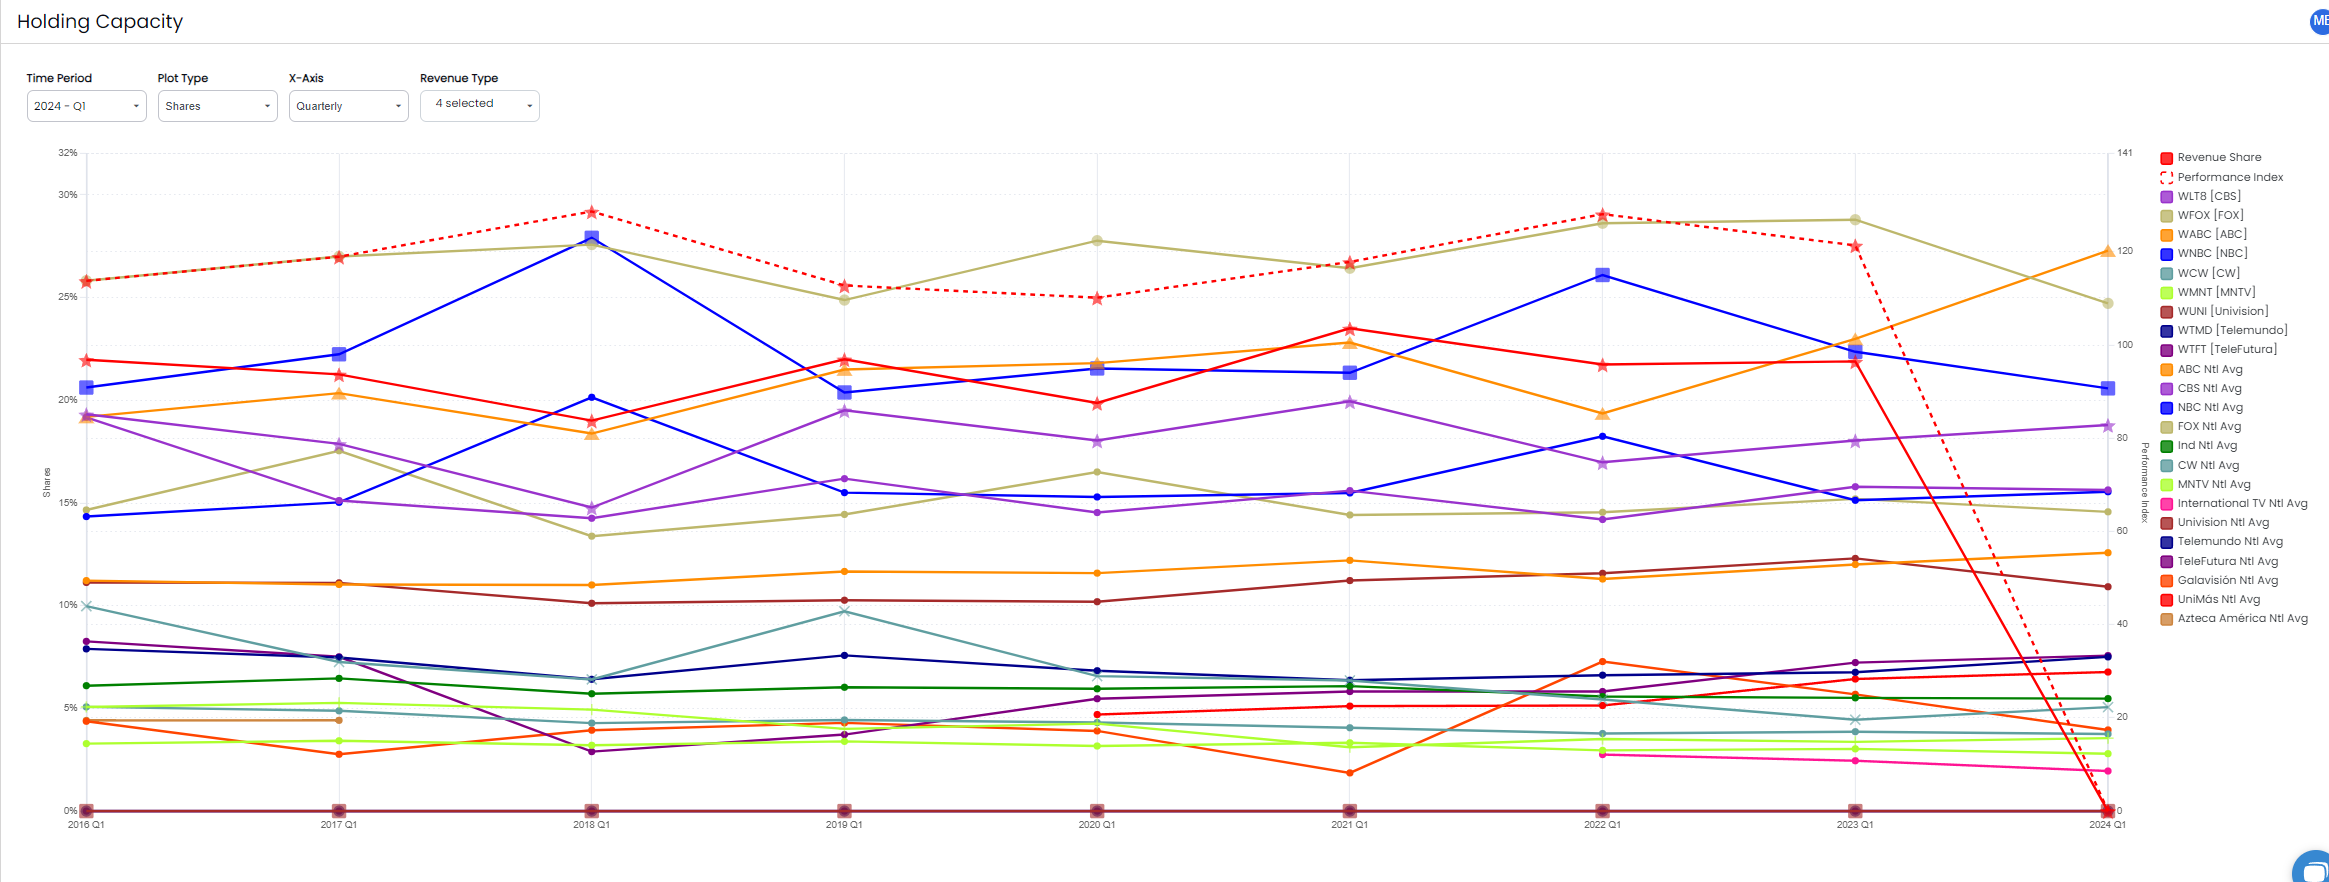
A Market Share Overview chart showing holding capacity share across stations in the market.
A Revenue Share view (typically sourced from third-party audits).
A Performance Index that compares your expected share to your actual share.
Helps you protect rate where you have pricing power and avoid over-selling inventory too cheaply.
Gives you context when the market changes (ratings down, sports changes, competitors pricing aggressively).
Supports smarter budgeting and forecast expectations by showing what share you’re positioned to capture.
Sales Principle: You don’t “win” by being the cheapest, you win by knowing where you have leverage and holding it.
Start with the Market Share Overview chart to see how shares compare across stations.
Look at Revenue Share and the Performance Index to understand whether your actual performance is above or below what the market would predict.
Use the controls at the top of the screen to tailor what you’re analyzing:
Time Period: Adjust the time range shown on the chart.
Plot Type: Switch between overall holding capacity shares, TRP shares, or raw TRPs.
X-Axis: Toggle between quarterly and yearly views.
Revenue Type: Select one or multiple revenue types to include.
Chart Legend: Click station names (or national averages) to compare against competitors.
Switching from Nielsen to Comscore?
Holding Capacity can integrate with Comscore via API. Transitioning typically requires Comscore approval (usually handled via a small set of emails).
Want to compare Nielsen and Comscore data?
If you subscribe to both, a dual model can be created so you can compare share outputs side-by-side (may involve an added monthly fee).
Market ratings are down—can Holding Capacity still help?
Yes. Even if market ratings/impressions decline, your share can rise—which can increase your pricing power.
No audit available?
Holding Capacity can still estimate market position using available units and ratings/impressions to build a market model.
Using impressions instead of ratings?
Holding Capacity supports impressions (especially via Comscore). If Nielsen impressions are important to you, ask your ShareBuilder team about availability/interest.
Need help with budgeting?
Holding Capacity models are often built in the summer for the following year to support budget season and realistic forecasting.
Losing a major sports package—what’s the impact?
The model can account for sports schedule changes (network and local sports adjustments) to keep expected share views accurate.
How are competitors’ rates so low?
Holding Capacity can’t see competitors’ skim data directly, but it can help explain what may be driving low rates (inventory shifts, unit count estimates, programming mix, and buyer behavior).