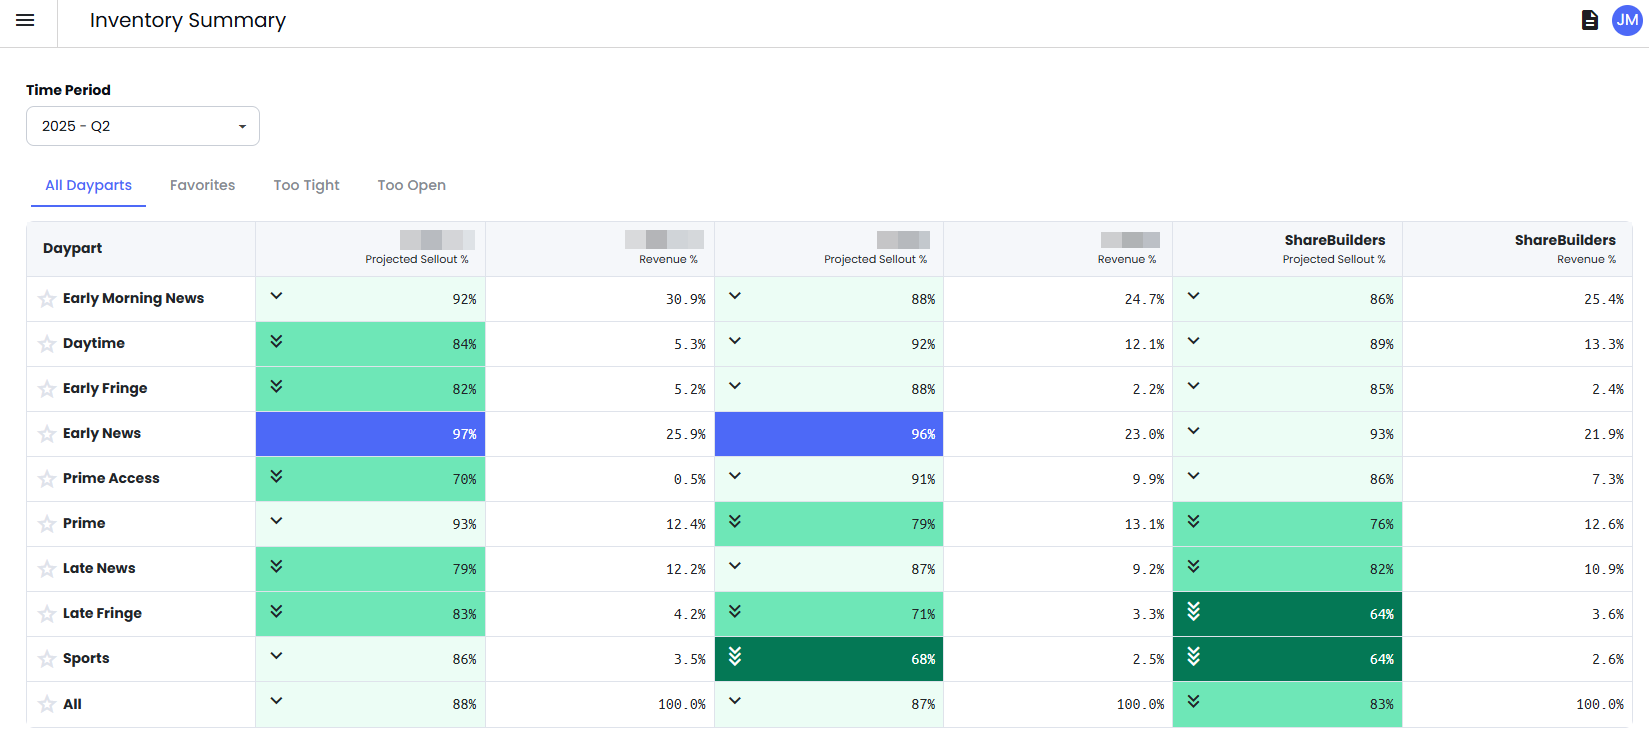
Inventory Summary is a high-level dashboard that shows your station’s pacing, sellout levels, and availability by daypart so you can quickly spot where inventory is getting tight (or where you have room to build demand).
It also lets you compare your station’s projected sellouts to:
your ownership group, and
the broader ShareBuilder client base
so you can understand whether a shift is station-specific or market-wide.
Faster prioritization: You don’t need to hunt—Inventory Summary highlights which dayparts deserve attention first.
Better pricing posture: If a daypart is tightening, you can protect rate; if it’s open, you can package and create demand—without guessing.
Stronger leadership conversations: Everyone can align on the same inventory “scoreboard” before deciding what to change.
Sales Principle: Don’t coach feelings, coach facts. A clear snapshot lets you coach the right action (hold, flex, or build demand) based on real sellout signals.
Open Inventory Summary.
Use Time Period to choose the quarter you want to review.
Use the tabs to filter what you’re trying to solve:
All Dayparts: Full snapshot of every daypart
Favorites: Quick access to the dayparts you monitor most
Too Tight: Dayparts trending tight (risk)
Too Open: Dayparts trending open (opportunity)
Inventory Summary shows projected sellout and revenue contribution in a grid, including benchmark columns (ownership group and ShareBuilders) so you can compare performance side-by-side.

Click a column header to sort dayparts—especially by revenue contribution—so you focus first on what has the biggest impact on the quarter.