The Sales Team Dashboard is a manager’s command center for understanding team performance at a glance. It brings together each seller’s key metrics - from activity and pipeline health to billing progress - so you can lead with clarity and coach with purpose. Learning how to interpret and use this view helps you move beyond reactive management to proactive leadership, spotting trends early and guiding your team toward consistent, measurable improvement.
By mastering the Sales Team Dashboard, you’ll strengthen your ability to:
Monitor each seller’s activity, pipeline, and progress without needing to pull multiple reports.
Identify outliers and trends that reveal where coaching or support is needed.
Use data as a foundation for meaningful 1:1 discussions and team meetings.
Track the impact of your coaching over time through changes in key metrics.
Foster a culture of accountability, where numbers reflect both effort and growth.
Use this checklist to confirm you can confidently interpret your team’s performance data and turn insights into action.
I can locate the Sales Team Dashboard and identify key metrics for each seller, such as activity counts, pending opportunities, and billing progress.
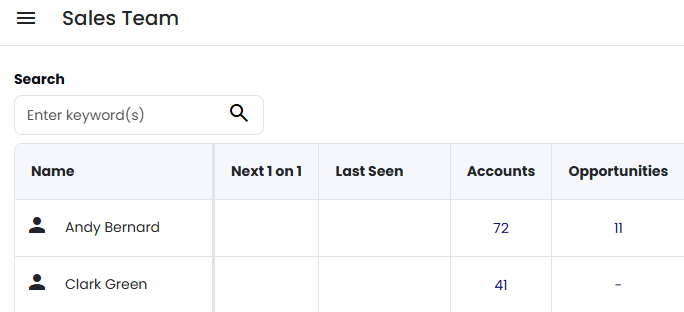
I can click into a Seller’s metrics to view their pipeline or activity details for deeper analysis.