Sales Analysis is your personal reporting and performance hub, built into the Seller Dashboard and pre-filtered to display only your data. It offers real-time visibility into how you’re pacing toward goals, what’s booked, what’s pending, and where gaps or growth opportunities exist.
You can view performance by multiple breakdowns such as accounts, product types, business units, agencies, and categories. This centralizes key performance metrics like actual revenue, pending dollars, forecast, and budget progress.
It’s a foundation for seller strategy, coaching conversations, and accurate forecasting.
At ShareBuilders, we believe that great sales performance starts with clarity, and the Sales Analysis tab provides Sellers with a clean, consistent, and actionable view of their business.
Here’s why it matters:
Transparency — Everyone (Sellers, Managers, GMs) sees the same numbers, turning conversations from “what’s real?” to “what’s next?”
Accountability — Budgets and forecasts are visible and trackable, helping you stay aligned to station and personal goals.
Better Decisions — Filters and drilldowns help you target where to grow, who’s at risk, and what to prioritize.
Strategic Alignment — Your work, your numbers, and your targets are all in sync — reducing confusion and boosting trust.
Ultimately, Sales Analysis is where strategy and execution meet. It’s not just what happened, but it’s also where you’re heading and how to get there.
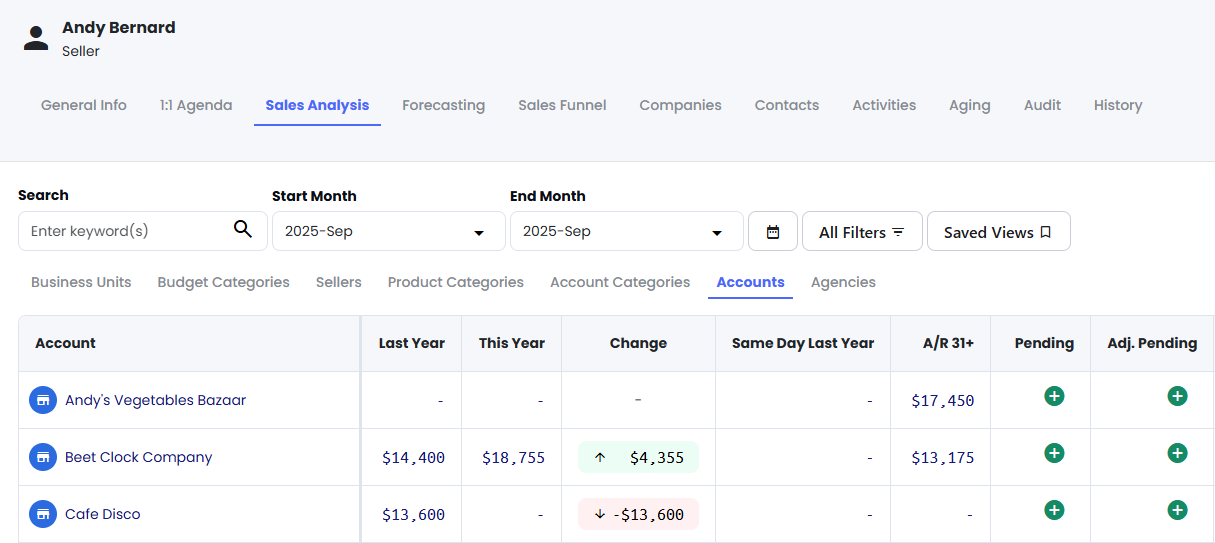
Switch Between Views - Each tab in the Sales Analysis section offers a different lens on your performance. Switching between them helps you uncover insights that aren’t obvious when looking at a single view
Use the tabs at the top of the page to explore different datasets:
Business Unit – Track revenue by platform (e.g. TV, Radio, Digital)
Budget Categories – See pacing across core budget types (e.g. Spot, Sponsorship)
Sellers – For team comparison (primarily used by managers)
Product Categories – Understand revenue mix by product
Account Categories – Focus on Key, Secondary, Target, Extra accounts
Accounts – View individual client performance
Agencies – Analyze influence and impact from ad agencies
Key Metrics You’ll See
Actual Revenue – What’s booked and invoiced
Pending Dollars – What’s expected based on your Sales Funnel
Forecast – A blend of pending, historical trends, and manager adjustments
Budget/Goal – What you’re aiming for
% to Goal – How close you are to hitting it
YOY / YO2Y – Compare this year’s revenue to past years for growth insights
Customize Your Columns
Drag & Drop: Reorder columns based on your workflow
Sort: Click on any column header to sort ascending/descending
Search & Filter Tools
Keyword Search: Type in search terms to locate specific accounts, agencies, or leads.
Filters: Refine by business unit, product, time period, and more